|
The Algol minimum of December 1-2, 2016
|
||||||||||||||||||||||||||||||||||||||||
|
Robert Nufer |
||||||||||||||||||||||||||||||||||||||||
|
Can't wait? Watch the Algol minimum movie at youtube |
||||||||||||||||||||||||||||||||||||||||
|
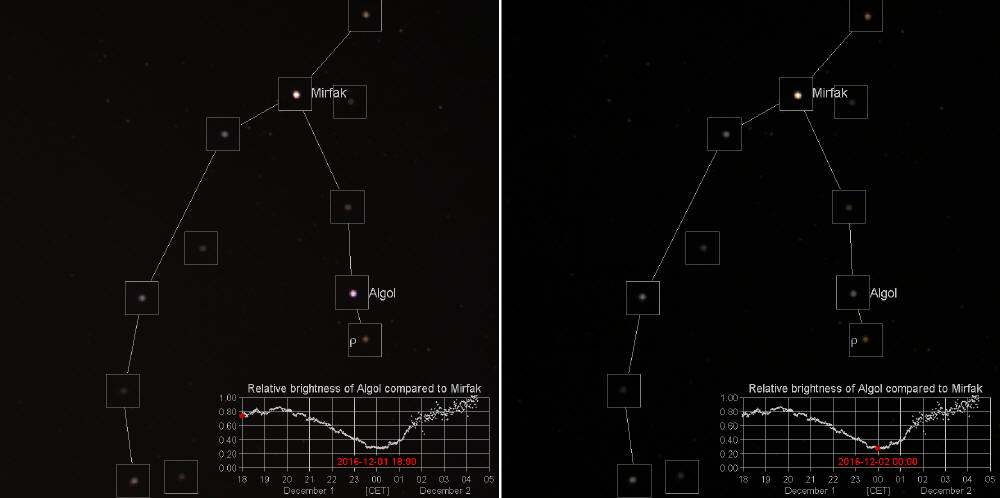
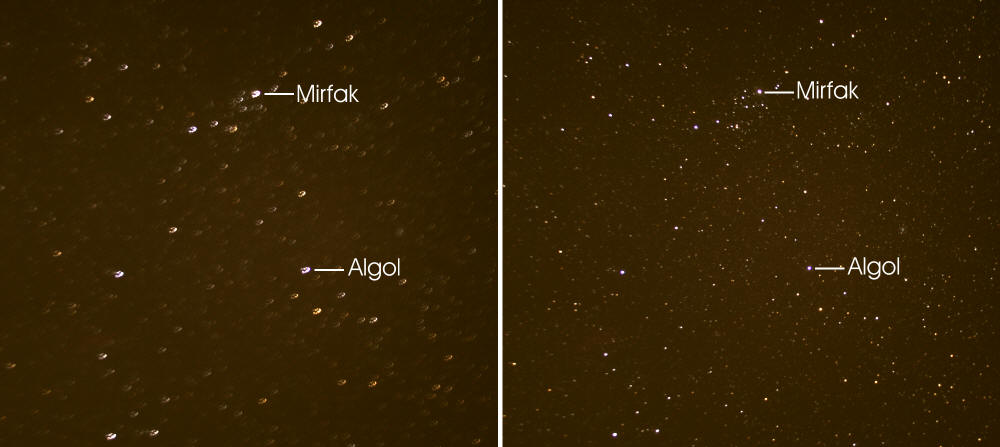
Left: Algol at "normal" brightness Dec. 1, 2016 18:00 CET. Most of the time, Algols brightness is similar to Mirfaks brightness. Right: Algol at minimum brightness Dec. 2, 2016 00:00 CET. But every 2.9 days, Algols brightess dims to the brightness of r Per.
The brightest stars in the Perseus constellation are Mirfak (a Per) and Algol (b Per). Every 2.9 days the brightness of Algol dips from magnitude 2.0 to magnitude 3.2. This transition phase takes about eight to ten hours. Within one or two hours around the minimum, Algol appears as faint as r Per, which can easily be observed by eye. These minima are often shown to visitors of astronomy clubs.
Here I describe my first attempt to record an Algol minimum light curve using a digital camera on a parallactic mount. The idea was to take every minute a picture fof the Perseus constellation, and to create a time lapse animation from the hundreds wide angle pictures, combined with a graphical representation of the brightness measurements of Algol. For this first approach, no color or other calibrations were applied. In what follows here, "brightness" is just the sum of the background subtracted pixel brightness values in the Red, Green, and Blue channels of the stars, after Flat-field correction.
Planning
Algol minima occur every 2.9 days, or three days minus three hours. If a minimum is missed for some reason (weather...), the next one could be observed three nights later, but then, three hours earlier in the night. If this minimum is missed too, there will be a gap of two or three weeks, depending on the favored observing time. Algol minima in the early night hours are practical for "public viewing", but the begin of the dimming phase is then not observable. The following conditions are required for a "complete" Algol minimum observation:
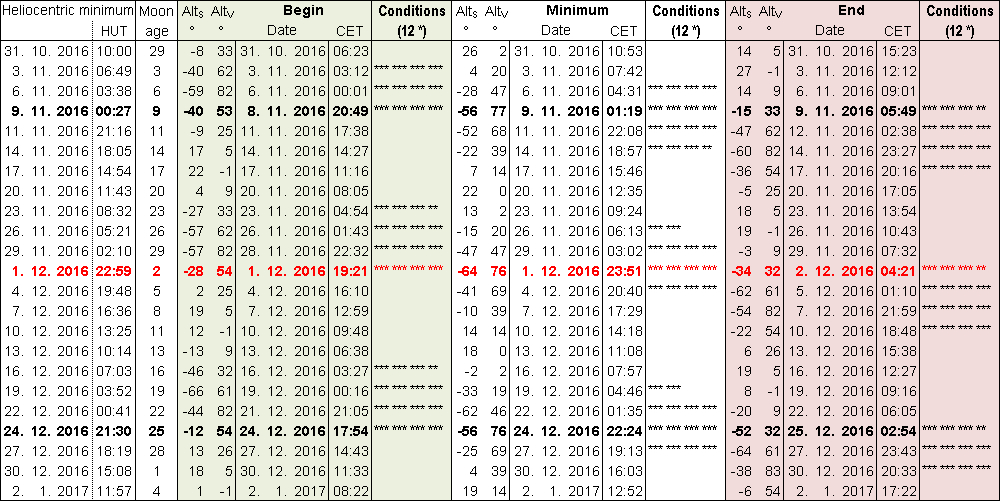
The combination of the first four requirements occurs only about three or four times per year between September and December. The following planning table was constructed using the Algol minimum elements published in the December 2016 issue of the Sky and Telescope magazine.
Excel spreadsheet for planning "complete" Algol minimum observations. The white columns in the middle show the altitude (elevation) of the Sun (AltS) and the variable star (AltV) Algol at the time point of the predicted minimum. The column Conditions lists up to 12 stars, if the Sun is far below the horizon, and if Algol is high in the sky. The green and red columns (Begin, End) show the situation 4.5 hours before and after the predicted minimum, respectively. "Complete" Algol minimum light curves can only be observed, if the Begin, Minimum, and End conditions contain stars.
Optimal conditions occur only after 8 periods, which is 23 days minus 90 minutes. For this experiment the Algol minimum of December 1-2, 2016 was chosen. The experiment was performed at a side facility of the Regio-Sternwarte Metzerlen observatory in Metzerlen/Switzerland, with optimal viewing conditions for the northern sky.
Setup
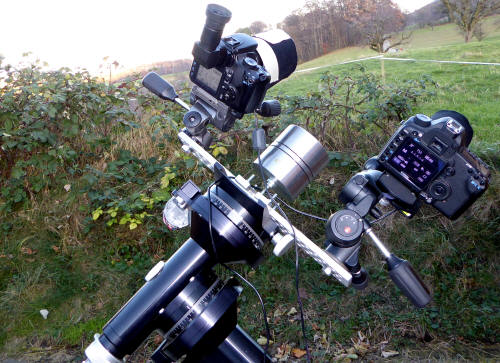
Two digital cameras (Canon EOS 5D Mark II and Canon EOS 400D) were used, one of them as spare. They were fixed on a dual camera holder including a counterweight for optimal balance throughout the night. The cameras were powered using 220 V AC adapters. These adapters are not optimal for usage at low temperatures (stiff cables, bad contact)! Dew caps (black felt) were mounted on both wide angle lenses, however, after midnight dew droplets on both front lenses started to freeze. The experiment with the 400D failed completely, but the images of the 5D Mark II were usable, even if only one tenth of the stellar information was recorded. More on this later. Exposures every minute were released using remote controllers model TM-A and TM from Enjoy Your Camera.com.
The night
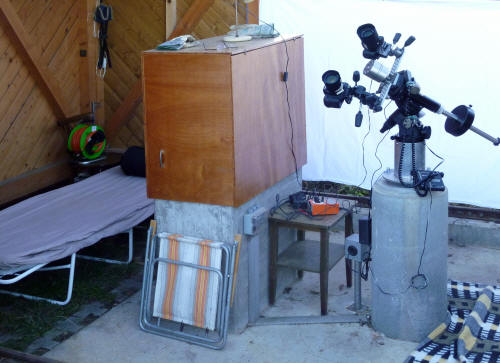
After setting up the cameras, I prepared the camp bed and the sleeping bag, because there was a long and cold night ahead. A hanging sheet on the western side reduced the airflow and light pollution from a nearby road. Before the experiment started and the camera temperatures were in equilibrium, ten bias images were taken. This was done with the shortest possible exposition time (1/8000 sec, and 1/4000 sec, respectively) and closed optics. Sunset was at 16:40 CET and one hour later it was dark enough to start the experiment. The telescope mount was powered and the camera remote controllers fired every minute a shutter release command. There was no additional guidance, because wide angle pictures were captured. Once every half hour or so I verified the alignment of the cameras with the Perseus constellation. I got cold and tried to sleep between the controls. All went fine, the sky was dark and clear, and after midnight, when Algol was in minimum phase, I hung the sheet to the eastern side, because the cameras pointed from now on more and more to the western sky. The front lenses were clear, and humidity didn't seem to be a problem tonight. I went to bed and had a good sleep until dawn. The RA motor worked well throughout the night, but the front lenses of both cameras were covered with an ice layer! For further analysis, only the images of the EOS 5D Mark II were used. The freezing started at 00:30 CET. The light intensity of the stars in the field dropped to less than 20 percent, but rough brightness estimations were nevertheless possible. To me, this "failure" was a challenge.
Data processing steps
Between December 1, 2016 17:56:15 CET and December 2, 2016 04:28:18 CET, a total of 573 images (in the Canon raw format .CR2) were found on the memory card. The expected number of images was 633, but some unusable images were deleted manually. Shortly after the start of the sequence, the exposure time was accidentally increased to 30 seconds. Because the noise reduction option was enabled, (which doubles the duty cycle,) only every second shutter release command was effective. At 23:30 CET the exposure time was set back to 20 seconds.
In a first step, the exif information was read from all image files using the free software exiftool v10.36 from Phil Harvey. (C:\> exiftool -t -list -csv -r *.CR2 >CR2.csv) The output file contains the complete information for each image, like exposure time, aperture, ISO value, date and time, ...
In a second step, the images were duplicated and converted to PPM format using the free software dcraw v9.16 from Dave Coffin. (C:\> for %a in (*.CR2) do dcraw -4 -t 3 %a). The PPM files are very handy for further processing, because the full 16-bit image information for all three color channels (red, green, blue) can be read with a single read instruction.
All further image and data processing was done by means of a proprietary Borland® Delphi® Pascal program, that I developed step by step. Intermediate tables and graphs were produced using Microsoft® Excel® 2010, which is an extremely helpful tool in this field of data processing.
To determine the correct alignment for each image, an averaged image was computed directly from all PPM files. The result is the left half of the image below. During the night, all stars drifted over some pixels of the image sensor, but not too much.
Left: Averaged image from all 573 images without any alignment. Right: Averaged image corrected for alignment of the individual images.
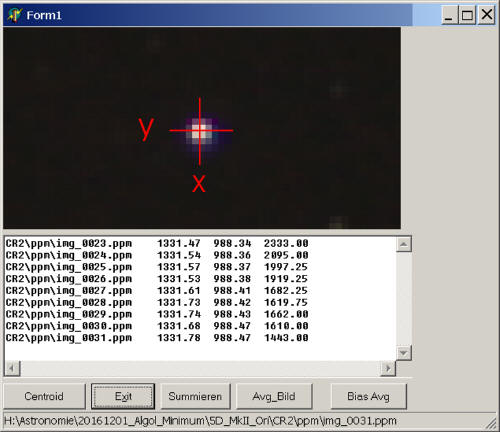
For the brightest stars, the exact position (centroid) was then found by searching the brightest spot in the individual images within the "smeared region" of the respective star. The brightness value for the star in each image was then computed by summing the pixel values, corrected for the image background. Finally, the brightness values for the stars were normalized to an exposure time of one minute, and corrected for the Flat-field value of the star location within the image. The Flat-field picture was created the next morning under clear (cloudless) sky conditions. The camera pointed to the zenith, and ten images were taken, while the camera made a complete rotation along the vertical axe. The Flat-field picture was computed by summing the PPM data of the three color channels per pixel. The Flat-field correction factors for the investigated stars were computed by dividing the brightness of the Flat-field at the stars position by the brightest pixel value in the Flat-field image.
Pixel coordinates and Flat-field values for the investigated stars in the experiment. The bias values were not further used in this experiment.
Results
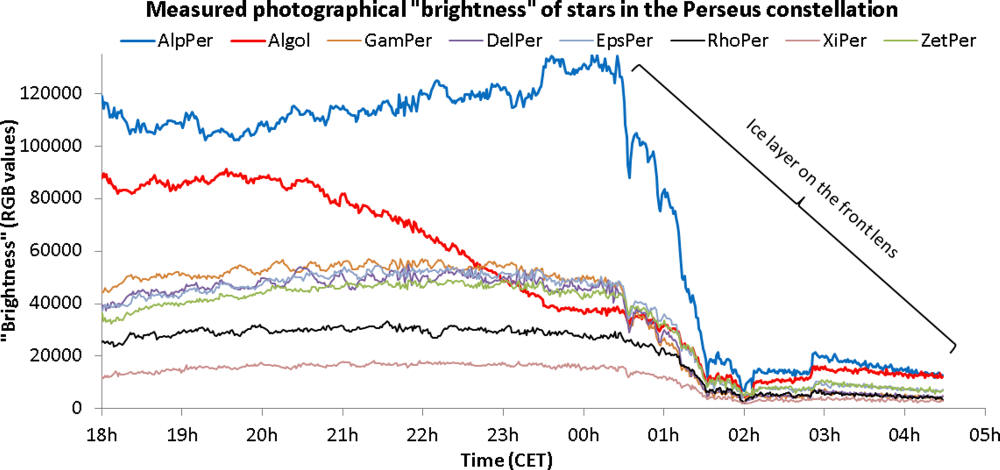
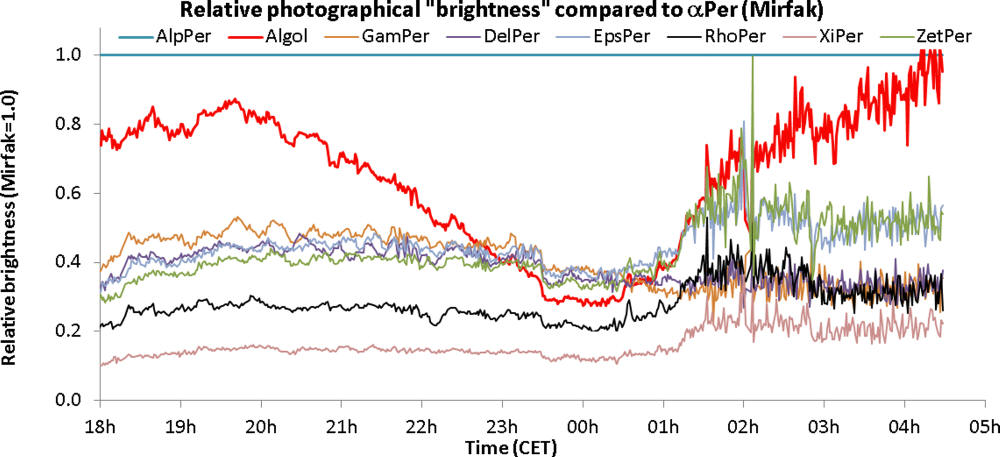
Ideally, numerical brightness values for Mirfak, and Algol, but also for some other brighter stars for the "complete" Algol minimum would have been found. But after 00:30 CET an ice layer formed on the front lens. Therefore, absolute brightness values became unusable. Fortunately, even with this ice layer on the front lens, data were usable to some extent. After 03:00 CET the relative brightness of all stars but Algol compared to Mirfak seen to be constant, but Algols brightness incrieases to the brightness of Mirfak, as expected.
At 00:30 CET an ice layer was formed on the front lens. Absolute brightness values became unusable after that time point.
Nevertheless, the relative brightness values were usable to some extent. A rough estimation of the time point of the Algol minimum at 00:00 CET was possible.
The movie (animation)
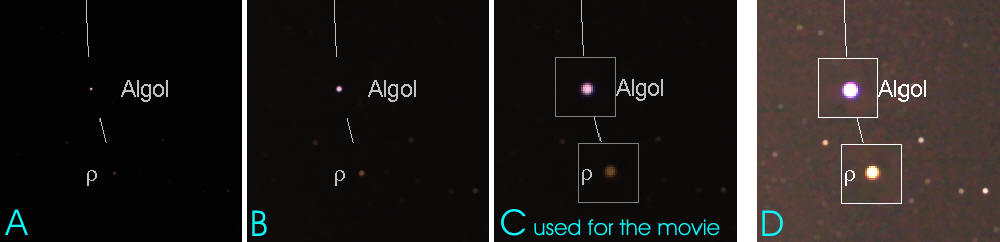
The goal of this experiment was to create a time lapse movie of a "complete" Algol minimum from real photographs in combination with a graphical light curve. Observing an Algol minimum under clear and dark sky conditions is easy, but not too easy. The stars in the Perseus constellation are not that bright as the very prominent stars in the Orion constellation, for example. First time observers need to be instructed, how to find the Perseus constellation, with its brightest stars a and b Per, Mirfak and Algol. Most of the time, Algol appears only slightly fainter than Mirfak, but in its minimum phase the his brightness dims significantly to the one of r Per in the extended connecting line from Mirfak to Algol. Due to the freezing process of the front lens, the later images became much darker, because stellar light was blocked by the ice layer. For the movie the brigtness of each image was corrected to the averaged captured light of the seven brightest stars, except Algol, of course. for this reason, the noise in the later part of the movie increases significantly, but images were still usable. On a series of sharp sky photographs, stars appear as very small spots. It is then difficult to locate the faint spots and to recognize differences in brightness (image A below). Therefore I decided to "smear" each image pixel over a 5 by 5 pixel area (image B below). The relative brightness of the stars does not change with this step. For the twelve brightest stars in the field of view, a further highlighting step was applied: A 15 by 15 pixel area centered at the stars image position was copied and pasted to a 30 by 30 pixel area centered at the same image position. In addition, these magnified squares were surrounded by a faint line, and the stars were labeled (image C below).
Image processing steps:
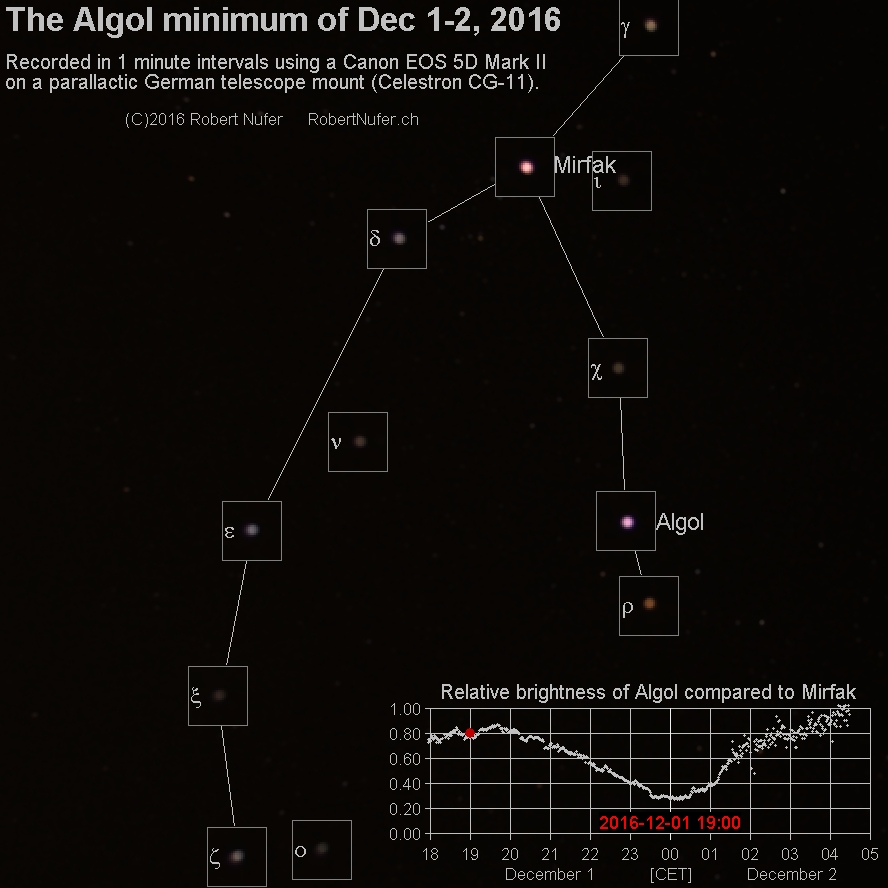
Representative frame at 19:00 CET. The twelve "magnified" stars are surrounded by a gray square and labeled with the respective Bayer designation or the proper name (Mirfak and Algol). The red dot indicates the time point of the image within the Algol minimum phase of that night.
Download the
Algol minimum movie (34 MB) |
||||||||||||||||||||||||||||||||||||||||